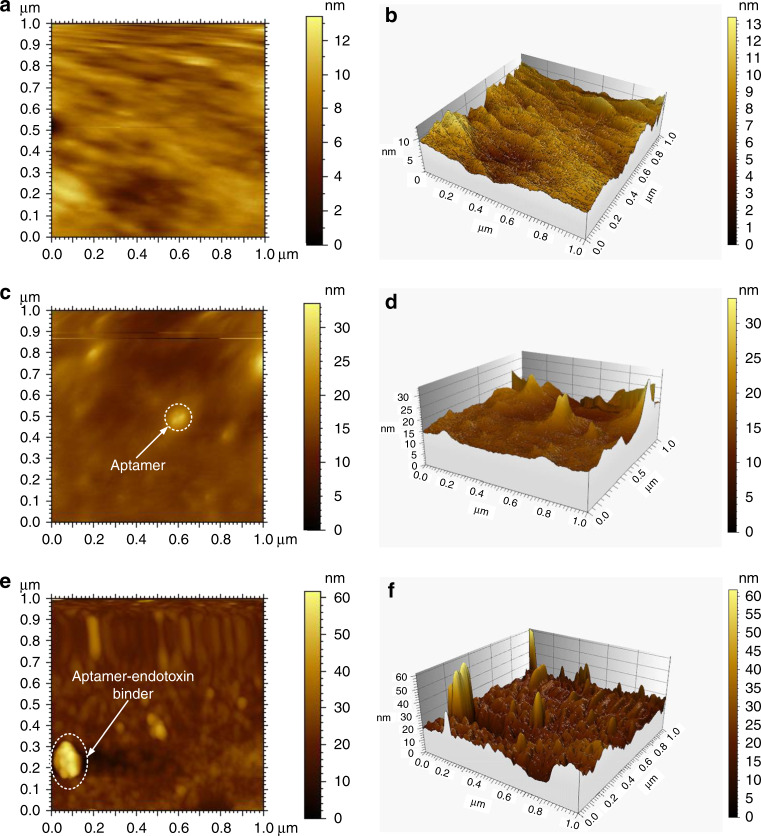
Fig. 6. The AFM images the surface morphology of the sensitive area with single-layered graphene during the experiments.
a, b AFM images of the surface morphology of the sensitive area with single-layered graphene. c, d AFM images of the surface morphology of the sensitive area after the aptamer was immobilized. e, f AFM images of the surface morphology of the sensitive area after the specific binding of the aptamer and the endotoxin.

