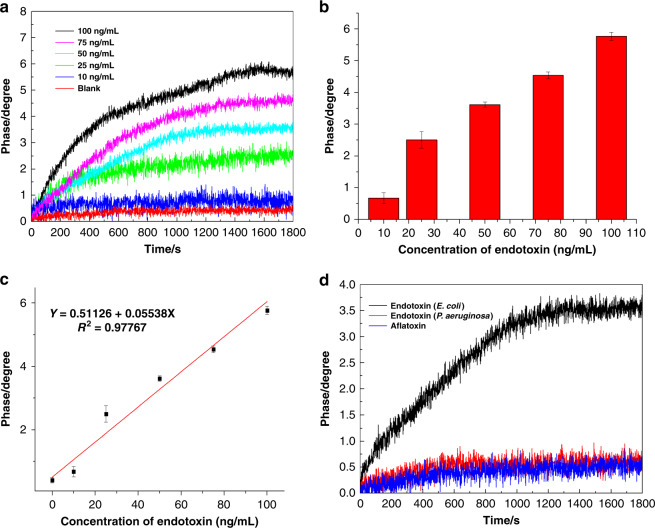
Fig. 8. The sensitivity and selectivity of the SH-SAW biosensor with SLG film.
a The real-time monitoring phase shift signals of the specific binding of the aptamer and the endotoxin at different concentrations. b Histogram of the specific binding of the aptamer to the endotoxin at different concentrations. c Standard curve for the quantitative detection of an endotoxin with an SH-SAW biosensor based on single-layered graphene. The phase shift on the y-axis had a linear relationship with the increasing concentrations of endotoxin on the x-axis. Each data point represents an average of at least three measurements ± the standard deviation. d The real-time phase signals of the endotoxin obtained from E. coli, the endotoxin obtained from P. aeruginosa, and the aflatoxin binding with the aptamer, which were all analyzed at concentrations of 50 ng/mL.

