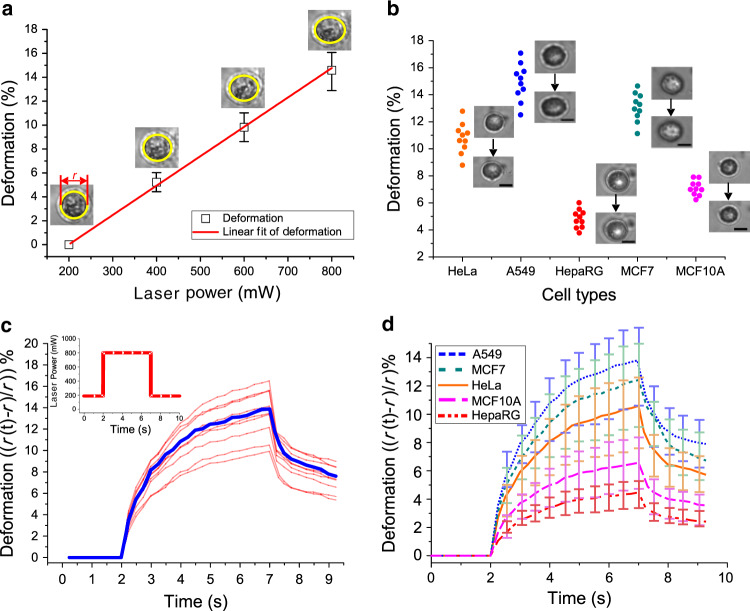
Fig. 3. Optical stretching-induced cell deformation and step-stress responses of cells under optical stretching.
a The maximum strain vs. laser power for the A549 cell, which was subjected to step-stress experiments with 200, 400, 600, and 800 mW laser power at a constant time of 20 s. b The maximum deformation of ten samples for the five types of cells with 800 mW laser power at a constant time of 10 s. Cell morphology before/after trap–stretch is shown for each cell type. Scale bar: 10 μm. c The step-stress response curves of ten A549 cell samples. The blue line outlines the average response of the ten cells. d The average step-stress responses of five different types of cells. Error bars in a and d correspond to the standard deviation for ten cell samples

