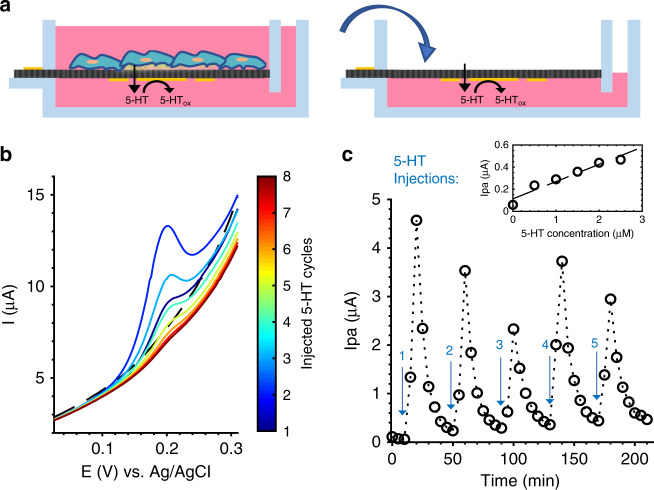
Fig. 6. 5-HT injection experiment—dynamic CV detection of 5-HT bursts and diffusion over time through a porous membrane.
a Schematic illustrating the mode of 5-HT release from cells (left) and our injection experiment, which simulates this mode of 5-HT release by repeated injections (right), which was monitored at an Au-CNT (2 µL) membrane electrode. b Representative CV curves over the course of one injection event, centered on the peaks. DMEM blank—black, dashed line. 5-HT injection—color denotes the cycle (1–8) with 5-min accumulation time between each cycle. c Full timeline of Ipa values generated by five injections of 5-HT, 40min apart, denoted by arrows. Inset: linear trend between the final Ipa value per injection and expected final 5-HT concentration: 0, 0.5, 1, 1.5, 2, 2.5 µM

