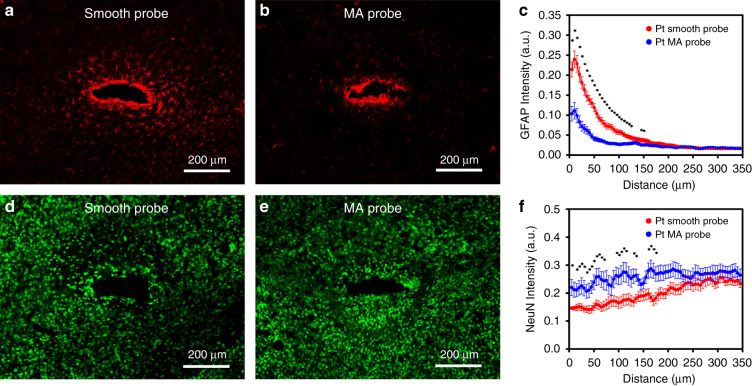
Fig. 4. Inflammatory response and neuronal survival around implants at 6 weeks after implantation in a mouse brain.
GFAP (a, b) and NeuN (d, e) immunostaining of Pt smooth probes (a and d, n = 18) and Pt MAPs (b and e, n = 16). Quantitative comparisons of GFAP (c) and NeuN (f) immunoreactivity between Pt smooth probes and Pt MAPs were performed by using intensity profiles as a function of the distance from the implant interface, shown as the means ± SEM (*p < 0.05, independent-samples t-test)

