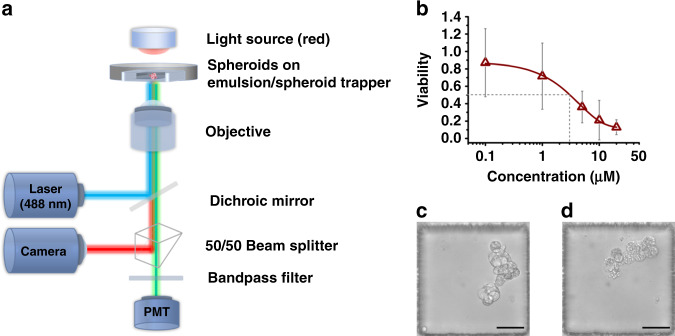
Fig. 6. Customized analytical platform for the in situ analysis of DEPMiC-cultivated spheroids.
a Schematic diagram of the analytical platform capable of simultaneously acquiring bright-field images and fluorescence signals. b The viability measured from individual spheroids under treatment with vinorelbine at titrated concentrations, where the IC50 value was determined to be ~3 μM, as marked by the gray dashed lines. c Morphological observations of identical spheroids before vinorelbine treatment and d after treatment with vinorelbine (20 μM) for 3 days. Data are plotted as the mean ± SD (n = 3 independent experiments). Scale bars: 50 μm.

