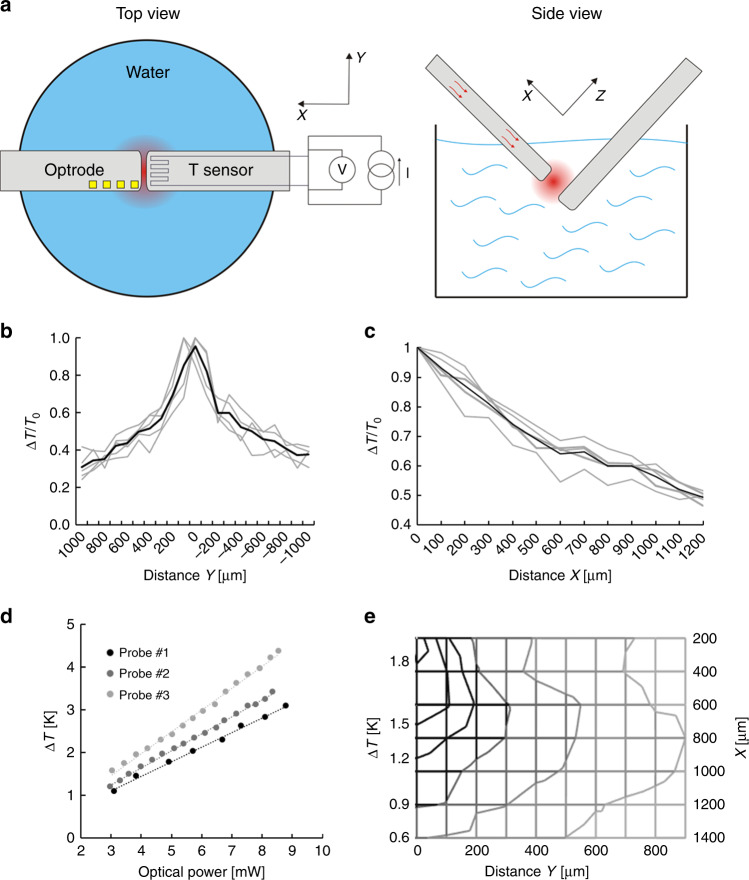
Fig. 2. Thermal characteristics of the integrated microdevice.
a Schematics of the in vitro experimental setup for the characterization of spatial temperature distribution. b Normalized distribution of the temperature increase along the y axis (x = 200 µm). c Relative rise in temperature as a function of distance between the tips of the immersed optrode and the external temperature sensor. d Calibration curves: optical power vs. rise in temperature. e 2D representation of the distribution of temperature rise along two perpendicular axes x and y. The location of the probe tip is considered the origin of the coordinate system

