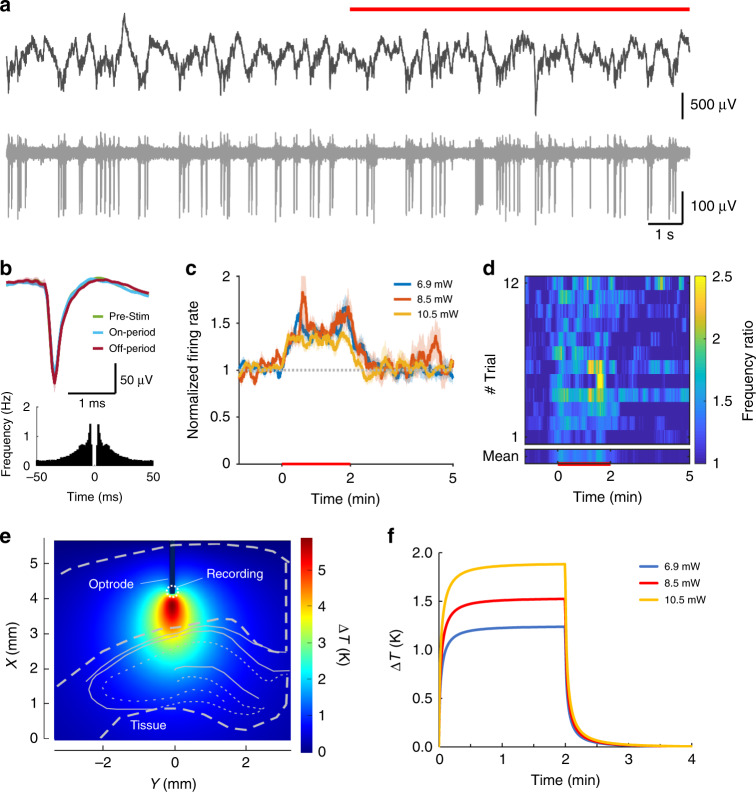
Fig. 3. Infrared excitation of cortical neurons.
a Local field potential (top) and unit activity (bottom) at 1300 μm cortical depth recorded from the multimodal probe before and during (red line) heating. b Waveform and auto-correlogram of a single unit clustered from the recording site on a. The spike waveform does not change between the pre-stimulus, stimulus-on, and stimulus-off periods. c Changes in firing rate of cortical multiunit for various excitation powers. d Average spike rate difference across trials (heat map). e Simulated temperature distribution during stimulus onset around the excited region at 10.5 mW and f simulated temporal change of temperature in the vicinity of the integrated temperature sensor of the optrode in the case of all applied optical power in this experiment

