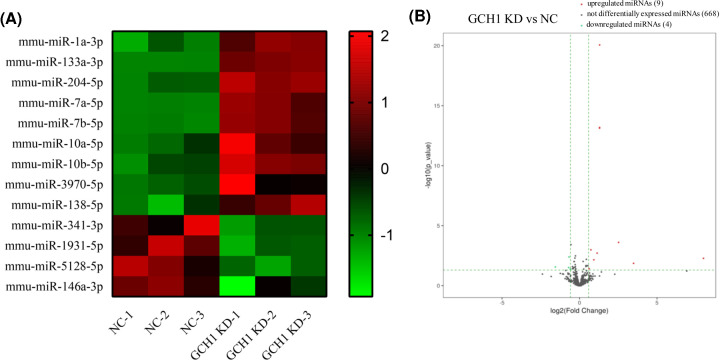
Figure 2. DE miRNAs between NC and GCH1-KD BV2 cells.
(A) Hierarchical clustering of DE miRNAs. Red indicates that the relative gene expression level is high, and green indicates that the relative gene expression level is low. (B) Volcano plots of DE miRNAs. Red dots represent up-regulated genes with >1.5-fold changes, green dots represent down-regulated genes with fold changes > 1.5, while black dots represent lack of significant differences between the two groups.

