
FIGURE 5.
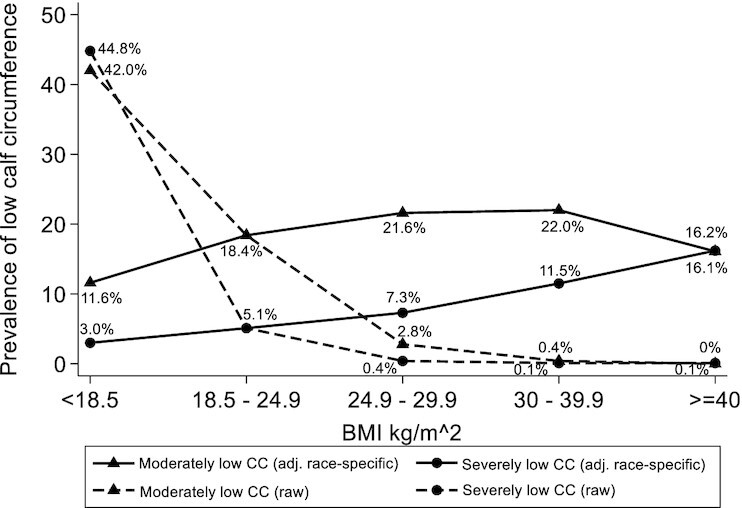
Low calf circumference (CC) prevalence according to BMI. Moderately or severely low CC: 1 (triangles) and 2 (circles) SDs below the mean from the reference population, respectively. Solid lines: using ethnicity and race-specific BMI adjustment factors and cutoff values. Dotted lines: using CC raw values and ethnicity and race-specific cutoff values. adj., adjusted.