Fig. 6.
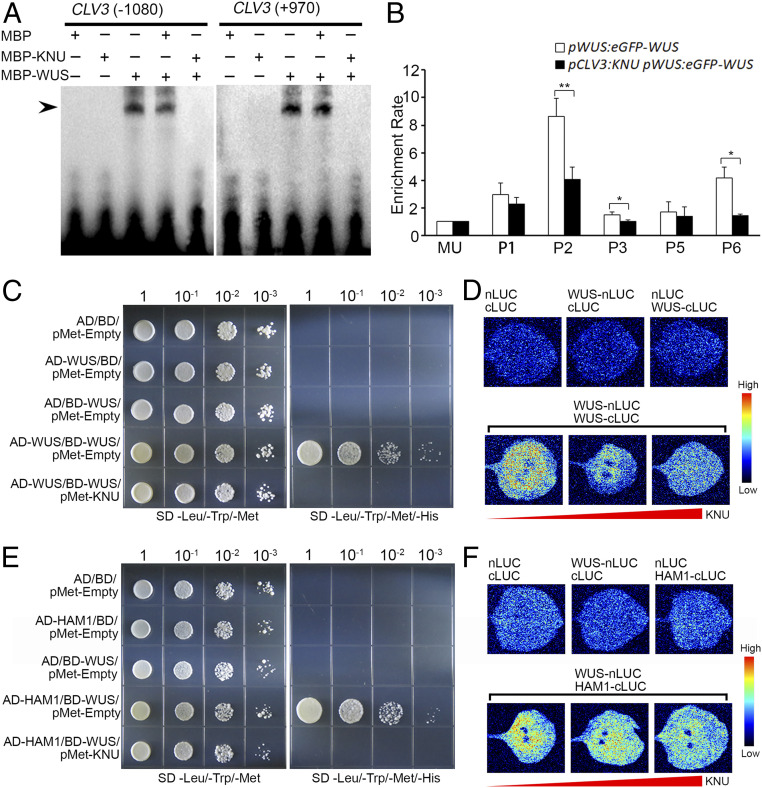
Effects of KNU–WUS interaction. (A) EMSA results showing that KNU inhibits the binding of WUS to CLV3. The black arrow indicates a DNA–protein complex. (B) ChIP assay using early flowers from pWUS:eGFP-WUS and pCLV3:KNU pWUS:eGFP-WUS. Nuclear proteins were immunoprecipitated with anti-GFP antibody, and the enriched DNA was used for qPCR assays. The y-axis shows relative enrichment using no antibody control. MU served as a negative control locus, and the values of MU were calibrated to 1. The error bars represent SD of three biological replicates. The asterisks indicate significant differences between two samples at certain primer sets on CLV3 (*P < 0.05 and **P < 0.01, Student’s t test). (C and D) WUS–WUS interaction is disrupted by KNU in Y3H (C) and BiLC assays (D). (E and F) WUS–HAM1 interaction is disrupted by KNU in Y3H (E) and BiLC assays (F). For Y3H assays, transformed yeast cells were grown on nonselective medium lacking leucine, tryptophan, and methionine (SD/−Leu/−Trp/−Met) and lacking leucine, tryptophan, methionine, and histidine (SD/−Leu/−Trp/−Met/−His) supplemented with 10 mM 3-AT for (C) or 75 mM 3-AT for (E). For BiLC assays, nLUC and cLUC refer to the N-terminal and C-terminal of luciferase, respectively. WUS-nLUC indicates WUS-nLUC fusion; WUS-cLUC indicates WUS-cLUC fusion, and HAM1-cLUC indicates HAM1-cLUC fusion. The color column on the right presents the range of luminescence intensity.

