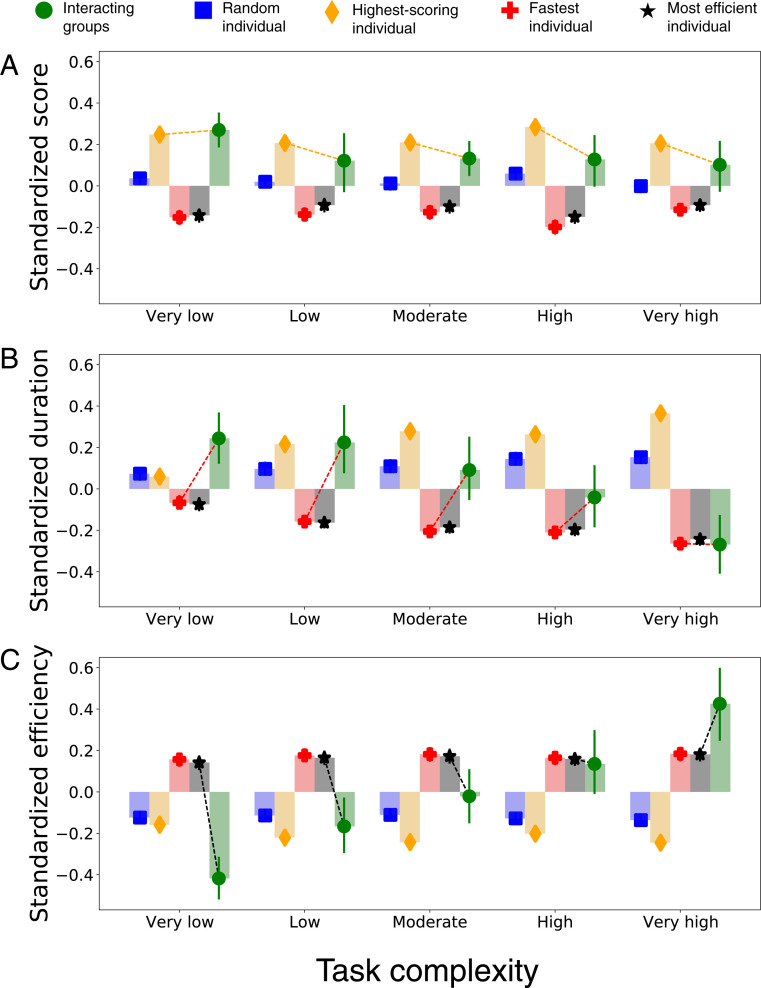
Fig. 3.
Comparing performance in terms of score (A), speed (B), and efficiency (C) across interacting groups and nominal groups. Data are combined across all six blocks and standardized (i.e., transformed to z scores) within each task complexity level (differences are relative within the complexity level and should not be compared across complexity levels). Error bars indicate the 95% confidence intervals. We have repeated the analyses presented in this figure for each block, with qualitatively similar results (SI Appendix, section S3 and Figs. S8–S10).

