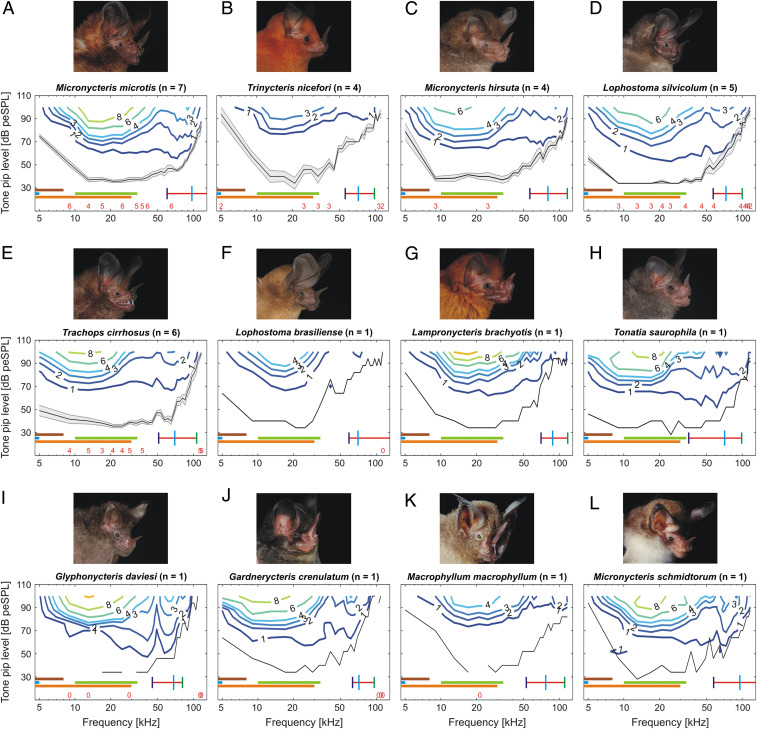
Fig. 1.
Audiograms of 12 gleaning bat species. Graphs depict species-specific (mean) ABR thresholds (black lines; shading presents SEM for species with n ≥ 3), which were calculated via bootstrap analyses. Measurements were conducted for 29 tone pip frequencies linearly distributed between 5 and 117 kHz and 13 sound levels between 28 and 100 dB peSPL in 6-dB increments. The iso-response lines (colored lines) represent the different strengths of the measured ABR signal (black numbers indicate ABR strength in μV). Species names and the number of measured individuals (n) are given in the respective plot title (A–L). Audiograms for single individuals (F–L) should be interpreted with care due to the low sample size (n = 1). Red numbers above the x-axes indicate the number of individuals used for calculating the mean ± SEM if the n was lower than the total sample size. The numbers are positioned above the corresponding frequency. Horizontal bars represent different prey frequency ranges: 2 to 8 kHz (crickets; brown), 0.4 to 5 kHz (frogs; light blue), 10 to 34 kHz (katydids; light green), and 3 to 30 kHz (prey rustling sounds; orange). The red horizontal bar in the audiograms indicates the recorded frequency bandwidth of the species-specific echolocation calls. Vertical bars represent minimum frequency (dark blue), peak frequency (light blue), and maximum frequency (green) of the calls. For detailed echolocation call parameter measurements, refer to SI Appendix, Table S3. Bat portraits here and in Figs. 2 and 3 courtesy of Marco Tschapka.

