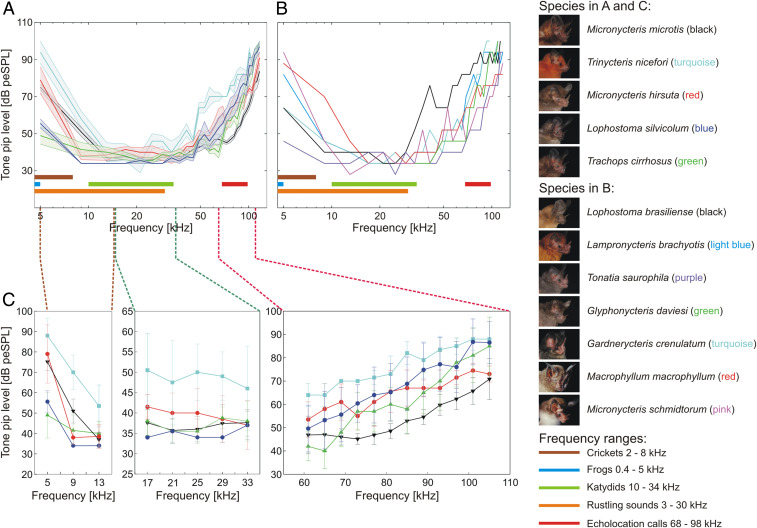
Fig. 2.
Comparison of audiograms of 12 gleaning bat species. (A and B) ABR thresholds (thick lines in different colors for each species) evoked by 29 tone pip frequencies linearly distributed between 5 and 117 kHz and 13 sound levels between 28 and 100 dB peSPL in 6-dB increments. (A) Mean thresholds and SEM (color shading around the lines) for five species with n > 1 individuals. (B) Thresholds for eight species with one individual. The different colored horizontal bars (in A and B) indicate the different frequency ranges of prey mating calls, prey rustling noises, or phyllostomid echolocation calls. (C) Detailed sections of the mean ± SEM. ABR thresholds of five species (M. microtis, M. hirsuta, L. silvicolum, T. cirrhosus, and T. nicefori) for three different frequency ranges. Left Panel: 5 to 13 kHz, Central Panel: 17 to 33 kHz, and Right Panel: 61 to 105 kHz.

