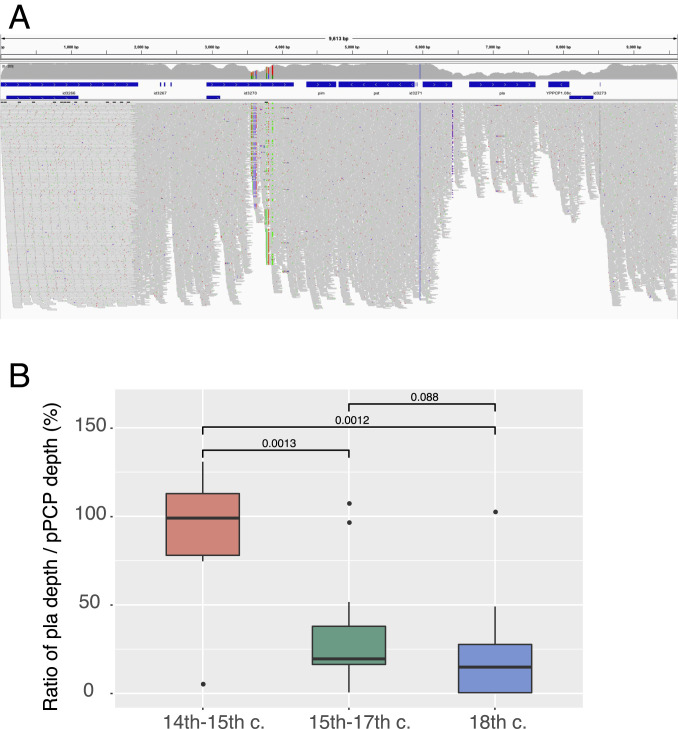
Fig. 3.
The decay of the pla gene. (A) Depth plot of the pPCP1 plasmid in strain CHE1 using Integrative Genomics Viewer. The annotated genes of the pPCP1 plasmid are marked with blue bars. The average sequencing depth of whole pPCP1 plasmid is 195.65x, while the average sequencing depth of the pla region is 96.04x. (B) Group-wise comparison of the ratio between the depth of pla and that of whole pPCP1 plasmid among three waves of the second pandemic. Boxplots depict the upper, median, and lower quartiles of the ratios; individual dots indicate outliers that lie outside of 1.5 times the interquartile range; and vertical lines indicate the range of all ratios except for outliers. The P values of group-wise comparison using the Wilcoxon test are labeled on the top, two of which are statistically significant (P < 0.05). Data of B are provided in Dataset S4.

