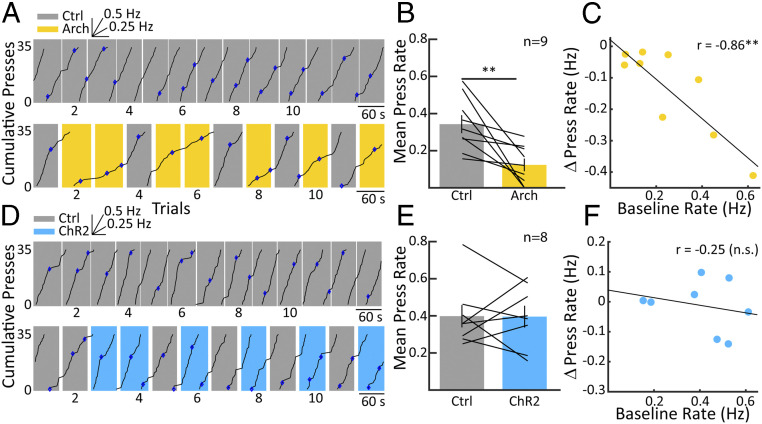
Fig. 2.
Effects of VP inhibition and excitation on operant behavior. (A) A cumulative record displays responses over time on a VI-30 schedule (Top). Each uptick on the chart indicates a lever press, with steeper slopes indicating higher lever-pressing rates and vice versa. The inset above shows the slope for a 0.25- and 0.5-Hz response rate, and blue diamonds indicate lever presses that resulted in a reward. The record resets to zero at 35 responses. Note that the animal is responding at a steady slow rate as is typical for this reward schedule. Below is a cumulative record from the same animal but including trials with 594-nm laser stimulation of Archaerhodopsin in the VP (yellow shading). During trials with Arch-mediated VP inhibition, the rate of lever pressing slows and recovers almost immediately in the control trials (gray shading). (B) The bar chart shows mean response rates across nine animals in control versus Arch conditions, showing that, on average, lever-press rates during Arch-mediated VP inhibition were suppressed in comparisons to control trials. (C) The change in lever-press rate is plotted versus the baseline rate taken from control sessions as in A, Top. The higher the baseline lever-press rate was for individual animals, the greater the reduction in rate resulting from Arch-mediated inhibition. (D) As in A but for an example animal receiving ChR2-mediated VP excitation. Again, at the top, the animal is responding in a slow, stable fashion. Below, we can see that during trials with 473-nm laser stimulation of ChR2 (blue shading), there is no apparent change in the response rate versus the control trials (gray). This is summarized in E, in which there is indeed no significant difference in lever-press rates between ChR2 on and off conditions. F is as C, except with the absence of a significant correlation between baseline lever-press rate and changes in response rate during ChR2 activation. Error bars reflect SEM; **P < 0.01.

