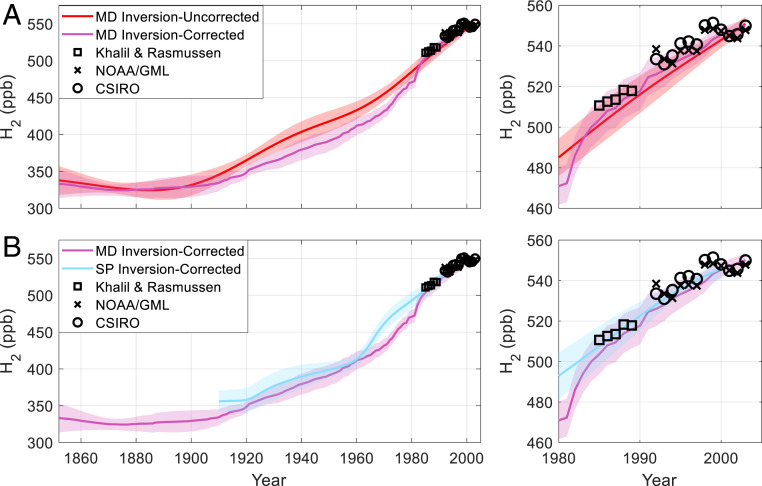
Fig. 3.
Atmospheric reconstructions of H2 with empirical corrections applied. (A) Red line and shading: Megadunes inversion result and ±1σ uncertainty as in Fig. 1A; purple line and shading: Megadunes Inversion result and ±1σ uncertainty using the empirical correction; black squares, black x’s, and black circles: atmospheric H2 annual means from high southern latitude sites from 1985 to 1989 and 1992 to 2003 as in Fig. 1A. (B) Purple line and shading, black squares, black x’s, and black circles: as in A; blue line and shading: corrected South Pole inversion and ±1σ uncertainty; and right panels: expanded view of the late twentieth century.

