Fig. 4.
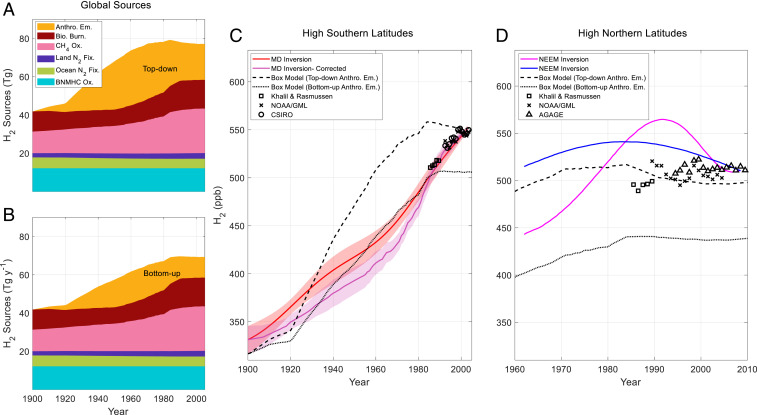
H2 global sources and atmospheric history for the twentieth century from firn air and the box model. (A and B) Global sources estimated from Pieterse et al. and Verhulst (SI Appendix; refs. 5, 33). In A, anthropogenic emissions are estimated using the top-down inventory of Pieterse et al. (5). In B, anthropogenic emissions are estimated from the bottom-up inventory of Vollmer et al. (50). (C) High southern latitude atmospheric H2 reconstructed from Antarctic firn air (red, purple lines, and shading: as in Fig. 3A) and 60 to 90° S box model simulations using top-down (dashed black line) and bottom-up (dotted black line) anthropogenic emissions. Observed atmospheric H2 annual means from high southern latitude sites from 1985 to 1989 and 1992 to 2003 are shown (2, 13, 17, 18). (D) High northern latitude northern hemisphere atmospheric histories of H2 from Petrenko et al. based on firn air measurements at the Northeast Greenland Eemian drill site (NEEM) using the Institute of Arctic and Alpine Research firn air model (blue line) and using the firn air model of Witrant et al. (magenta line: ref. 62) adjusted from the NOAA96 to the MPI09 calibration scale (20). Observed atmospheric H2 annual means for high northern latitude sites from 1985 to 2008 are shown (2, 13, 17, 19). Box model simulations are shown for 60 to 90° N using top-down (dashed black line) and bottom-up (dotted black line) anthropogenic emissions.

