Fig. 5.
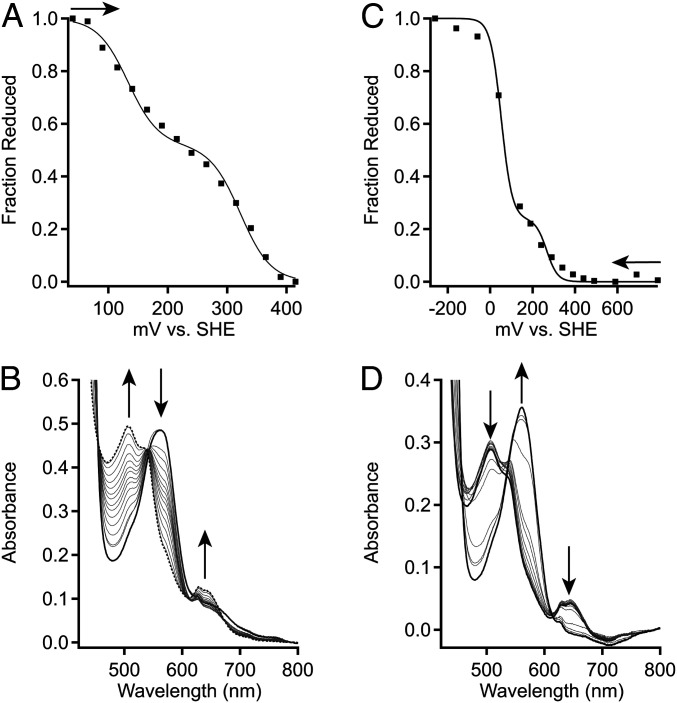
Electrochemical characterization of DcpG. (A) Representative oxidative titration of DcpG Fe(II) in 100 mM potassium phosphate 50 mM KCl pH 7.0. Midpoint values were determined by plotting the fraction of reduced heme against the potential. The fraction of reduced heme was determined by tracking the spectral changes at 571 and 641 nm. The representative data (black-filled squares) were fit using SI Appendix, Eq. S1, which describes a species with two redox active components. (B) Absorption spectra of DcpG from optically transparent thin layer electrochemical cell (OTTLE) cell oxidative titration. UV-visible spectra were recorded for each set potential (Top). (C) Representative reductive titration of DcpG Fe(III) in 100 mM potassium phosphate 50 mM KCl pH 7.0. Midpoint values were determined by plotting the fraction of reduced heme against the potential. The fraction of reduced heme was determined by tracking the spectral changes at 571 and 641 nm. The representative data (black-filled squares) were fit using SI Appendix, Eq. S1, which describes a species with two redox active components. (D) Absorption spectra of DcpG from OTTLE cell reductive titration. Arrows show direction of titration [oxidative (A)] or reductive (C) or change in peak intensities (B and D).

