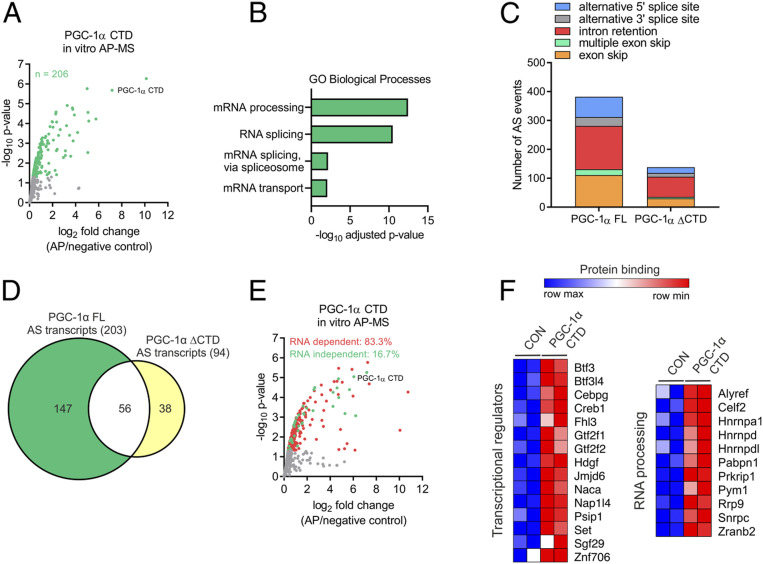
Fig. 2.
Most PGC-1α CTD protein interactions depend on RNA binding. (A) Volcano plot with green dots representing proteins interacting with the CTD of PGC-1α. (B) GO analysis of PGC-1α CTD interactome. (C and D) Alternative splicing (AS) analysis of transcriptomic data showing the number of AS events (C) and transcripts (D) regulated by PGC-1α FL or ΔCTD in C2C12 myotubes. (E) Volcano plot with red and green dots representing PGC-1α CTD RNA-dependent and -independent protein interactions, respectively. (F) Heat maps showing PGC-1α CTD RNA-dependent protein interactions with proteins regulating gene transcription and RNA processing.

