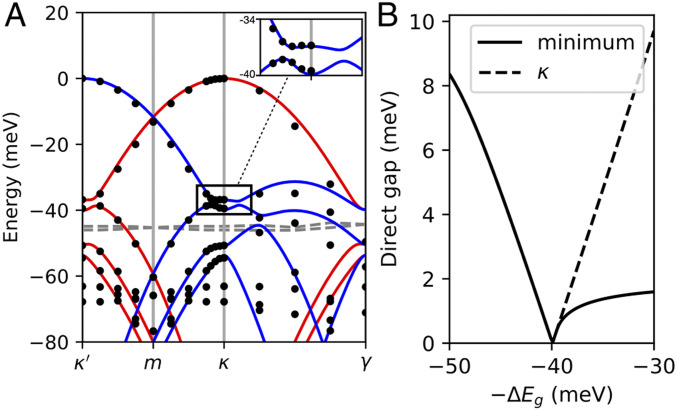
Fig. 6.
(A) Band structure of the continuum model with parameters mentioned in the main text. Blue lines indicate -valley bands, and red lines indicate -valley bands. The black dots represent the DFT bands computed for the heterobilayer at displacement field V/nm (dashed lines are states originating from the Gamma pocket). A, Inset shows the avoided crossing due to interlayer hybridization near . (B) The direct gap between the first two -valley bands at and minimized over , as a function of . The first band has a nontrivial Chern number for meV.

