Fig. 5.
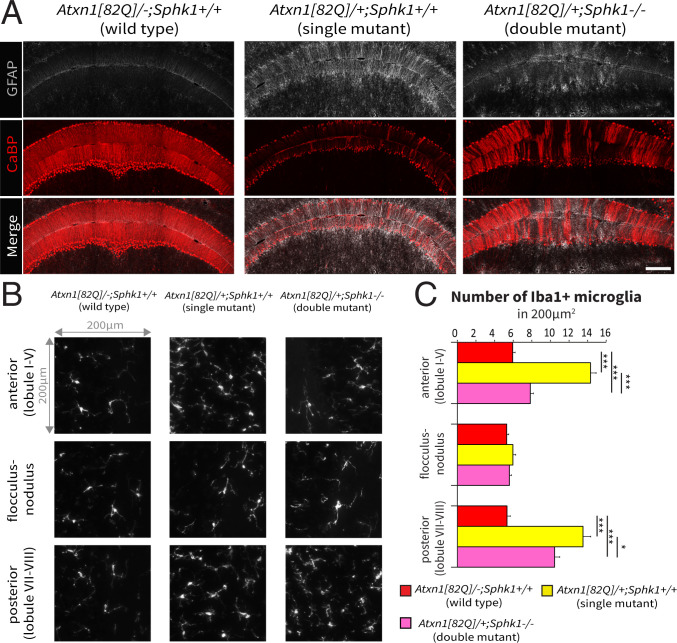
Immune response correlates with the severity of PCs degeneration. (A) Immunostaining for GFAP (gray) and CaBP (red) proteins in the wild-type (Atxn1[82Q]/−; Sphk1+/+), single-mutant (Atxn1[82Q]/+; Sphk1+/+), and double-mutant (Atxn1[82Q]/+; Sphk1−/−) mice. (Scale bar: 200 m.) (B) Iba1+ microglia density in a window of 200 × 200 m in three regions: the anterior (lobules I to V), the posterior (lobules VI and VII), and the flocculonodular cerebellum. (C) Quantification of Iba1+ microglia in a window of 200 × 200 m. Number of samples: three regions of interest per section, three sections per region, and three mice per genotype. Statistical analyses for activated microglia counting were performed with one-way ANOVA and post hoc analysis with Bonferroni correction to compare all genotypes (black asterisks). *P < 0.05; ***P < 0.001.

