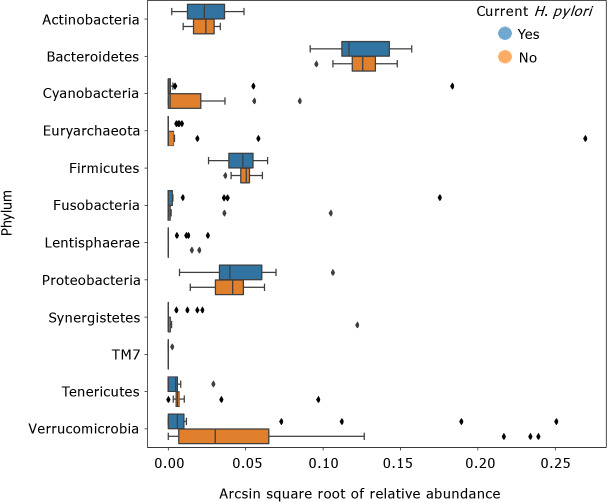
Figure 4.
Transformed relative abundances of phyla grouped by Helicobacter pylori infection. Arcsin square root transformed relative abundances of each phylum, grouped by Helicobacter pylori (H. pylori) status. Bacterial relative abundances of H. pylori patients (n = 19) are shown in blue, whereas healthy controls (n = 16) are shown in orange. Boxes represent the 1st and 3rd quartiles, and vertical lines in the middle of the boxes represent median values. Whiskers represent the lowest and highest non-outlier values. Points show outliers, which were determined by having a distance from the 1st or 3rd quartile greater than 1.5 times the interquartile range. Of note, relative abundances of Verrucomicrobia were significantly lower in H. pylori patients compared to healthy controls (Kruskal-Wallis H = 4.455, P = 0.034). H. pylori: Helicobacter pylori.

