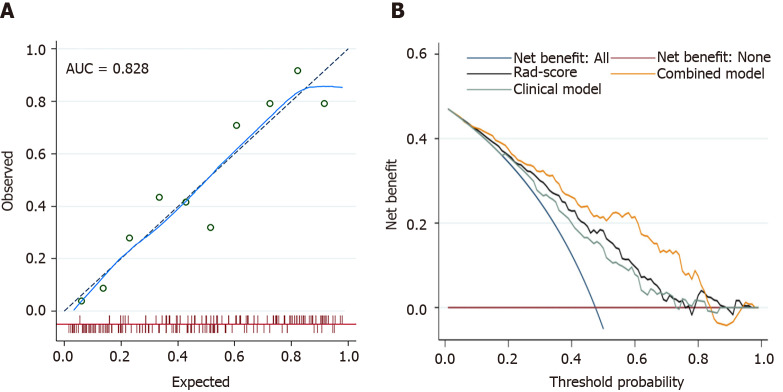
Figure 4.
The fit and usefulness evaluation of the nomogram. A: The calibration curve of the nomogram shows a good agreement between the predicted and observed risks in the training cohort; B: The decision curve demonstrates that the nomogram (combined model) obtains more benefit than “treat all”, “treat none”, Rad-score, and the clinical model, when the threshold probability is in the range of 10% to 83%. AUC: Area under the receiver operating characteristic curve.

