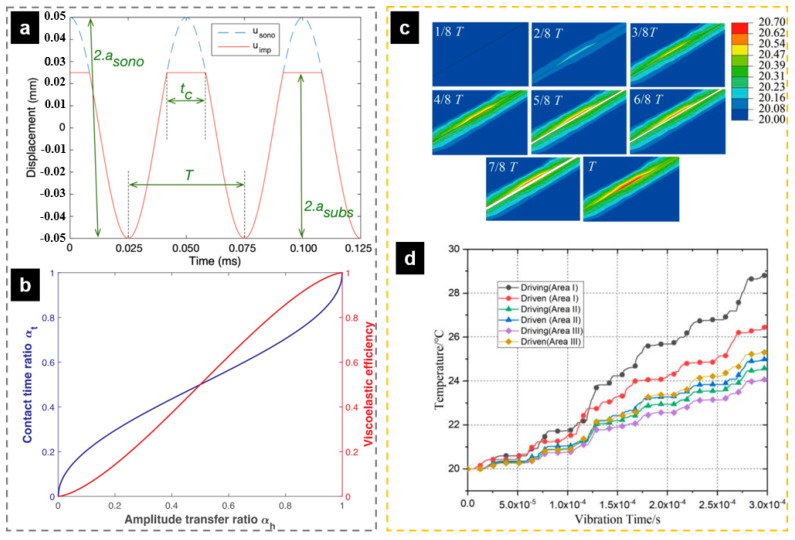
Figure 32.
(a) Displacement of the sonotrode and upper adherend versus time; (b) Viscoelastic efficiency e vs. amplitude transfer ratio αh [144]; (c) The nephogram of temperature change of analysis results during T/8–T; (d) Transient temperature trend curve of the node with the highest temperature in the three regions of the friction interface [111].

