Figure 5.
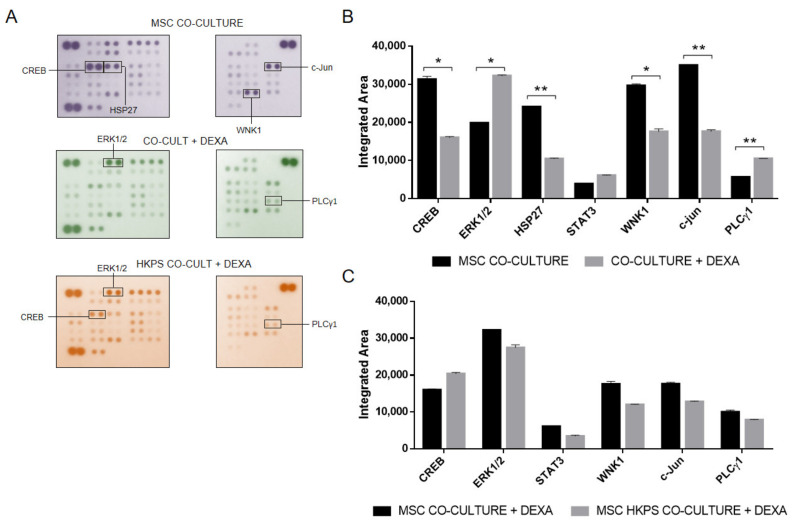
Sensitization to chemotherapy by HKPS could involve other kinases. (A) Changes in the phosphorylation profile of MSC after treatment with DEXA. Co-cultures were established with B-ALL cells and treated or not with DEXA (500 nM) for 2 h. In addition, MSC were pre-treated with HKPS for 2 h, then co-cultures were established for an additional 2 h in the presence of DEXA. After removal of B-ALL cells, MSC were lysed, and 350 ug of protein were incubated in a proteome array. The molecules that changed more than 50% are indicated in a square, as well as those that were inhibited by HKPS. (B) Quantification of the phosphorylation status of the kinases with the highest variation after DEXA treatment. The integrated area was determined based on the intensity of each dot. (C) Quantification of the phosphorylation status of the kinases with the highest variation after HKPS and DEXA treatments. In the column graphs, data are expressed as mean ± SEM (p values: Multiple t-test * p < 0.05, ** p < 0.01). Data are from one experiment in duplicate.

