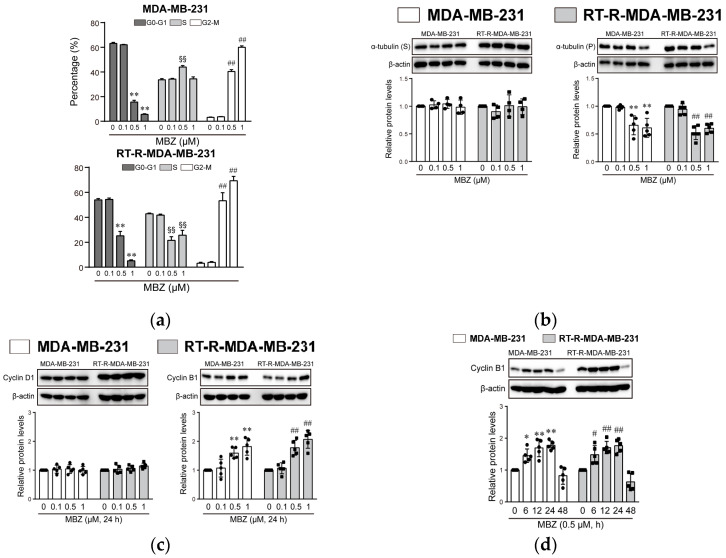
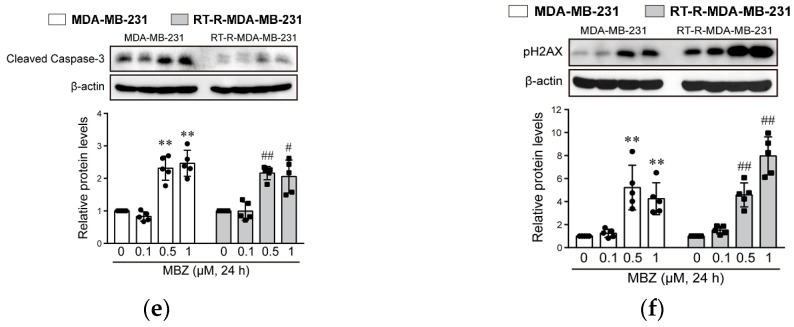
Figure 6.
MBZ blocks cell cycle progression of both MDA-MB-231 cells and RT-R-MDA-MB-231 cells in the G2/M phase through inhibiting tubulin polymerization. (a–c) MDA-MB-231 and RT-R-MDA-MB-231 cells were treated with MBZ (0.1, 0.5, and 1 μM) for 24 h, and the (a) cell cycle distribution was analyzed quantitatively by flow cytometry analysis. The data represent the mean ± SD of three independent experiments. ** p < 0.01 compared with control in the G0-G1 phase; §§ p < 0.01 compared with control at the S phase; ## p < 0.01 compared with control in the G2/M phase. (b) α-tubulin expression and (c) cyclin D1 and cyclin B1 expression were analyzed by Western blot. The data represent the mean ± SD of five independent experiments. ** p < 0.01 compared with control of MDA-MB-231 cells; ## p < 0.01 compared with control of RT-R-MDA-MB-231 cells. (d) MDA-MB-231 cells and RT-R-MDA-MB-231 cells were treated with MBZ (0.5 μM) in a time-dependent manner (6, 12, 24, and 48 h), and the cyclin D1 and cyclin B1 expression were determined by Western blotting. The data represent the mean ± SD of five independent experiments. * p < 0.05, ** p < 0.01 compared with control of MDA-MB-231 cells; # p < 0.05, ## p < 0.01 (e,f) compared with control of RT-R-MDA-MB-231 cells. (e) Cleaved caspase-3 and pH2AX protein levels were examined in the cell lysates of cells treated with MBZ (0.1, 0.5, and 1 μM) for 24 h. The data represent the mean ± SD of five independent experiments. ** p < 0.01 compared with control of MDA-MB-231 cells; # p < 0.05, ## p < 0.01 compared with control of RT-R-MDA-MB-231 cells.


