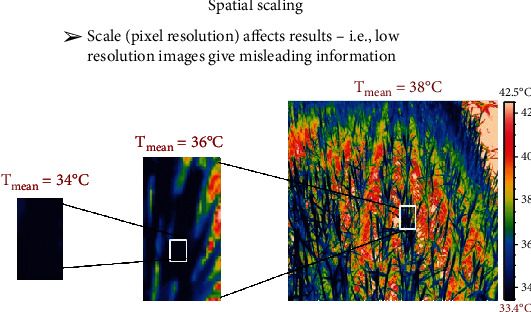
Figure 2.

The importance of obtaining thermal data for just the leaves/canopy of interest is highlighted by the 4°C difference between the actual leaf temperature shown on the far-left and the resulting mean CT from the image on the far-right. The image on the far-right comprises all the pixels from the plot of interest and has a resulting mean CT of 38°C; the mean CT is clearly influenced by the soil pixels. The central image comprises considerably fewer pixels; however, the mean CT is 36°C and 2°C warmer than the image on the far-left that comprises only leaf pixels. The prevalence of incomplete ground cover impacting CT measures is more likely to be encountered in water-limited environments and in the planting configurations used in breeder's nurseries, owing to limited seed per genotype in early generations. Further work is required to develop routine methods for thresholding the background soil temperature and extracting thermal data exclusively from the plant material of interest. The thermal image was acquired using a FLIR® A655sc thermal infrared camera with a 13.1 mm lens.
