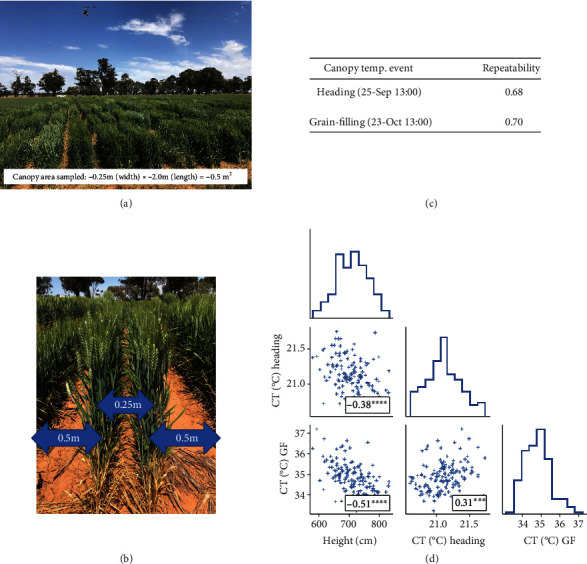
Figure 3.

Example application of airborne thermal imagery to quantify canopy temperature (CT) on small plots using the previously described airborne thermography method [64]. (a) The experiment, comprising two replications of 133 commercially released wheat varieties, and manned-helicopter used to capture CT. (b) Each plot comprised two rows, 0.25 m apart, about 2.7 m in length and with 0.5 m interplot spacing. This plot configuration is utilised by an Australian breeding company and is therefore representative of the small plots commonly used in breeding nurseries to evaluate early-generation germplasm. Results are shown for (c) two CT events made during the heading and grain-filling growth stages as repeatability estimates and (d) Pearson correlations between genotype BLUPs for the two CT events and canopy height. Given the smaller plot size, the (c) high repeatability estimates for the two events are encouraging as the thermal camera resolution (640 × 480) can limit the CT data quality. Note the significant association between (d) CT events and the high negative associations between CT and height, despite only a small range in height of about 0.2 m. Therefore, to better relate CT to stomatal conductance, further research is required to develop methods that can account for variation in height when sampling CT, eliminating boundary-layer effects. Thermal images were acquired using a FLIR® A655sc thermal infrared camera, with a 13.1 mm lens, mounted on a manned-helicopter flying at an altitude of 50 m, resulting in a pixel size of 6.5 cm. Approximately, 90 to 110 pixels were acquired per plot by selecting an inner section of the plot canopy: three or four pixels across the width of the plot (ca. 0.25 m) and ca. 30 pixels along the length of the plot (ca. 2.0 m). Repeatability and genotype BLUPs were estimated at each individual sampling time using the SpATS package [160].
