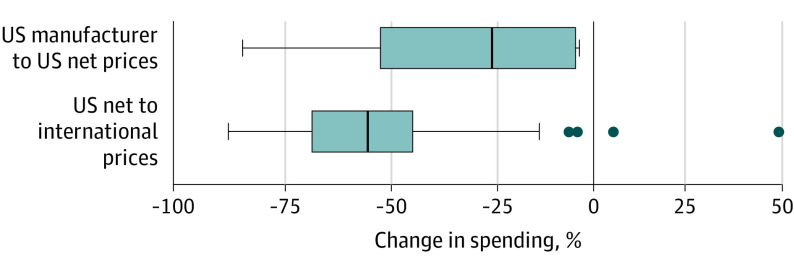
Figure 2. Product-Level Percent Changes in Spending at 2020 US Volume and Different Prices.
The analysis was limited to 10 insulin products and 50 other select single-source, brand-name drugs. Vertical lines through the solid boxes represent medians, the widths of the solid boxes mark the IQR, the whiskers represent adjacent values, which are defined as the largest and smallest data points within 1.5 times the IQR, and dots indicate points that fall beyond the whiskers.

