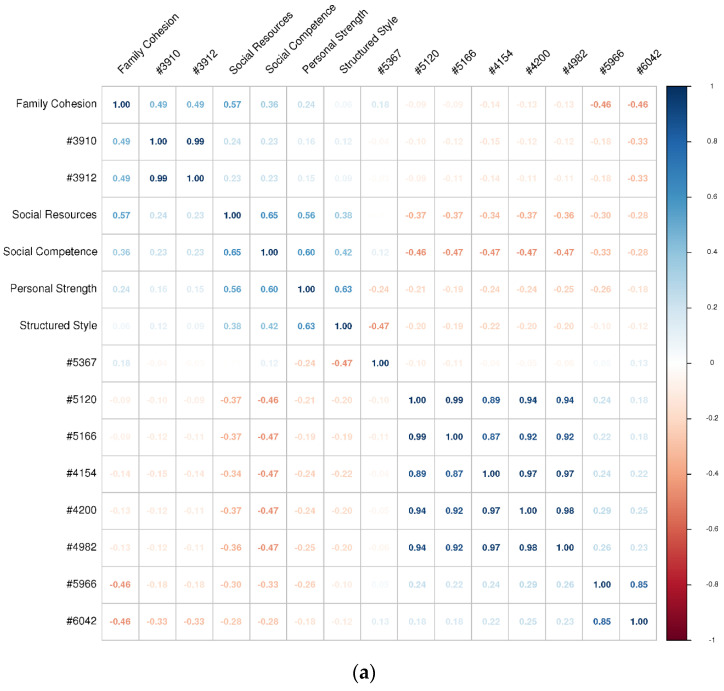
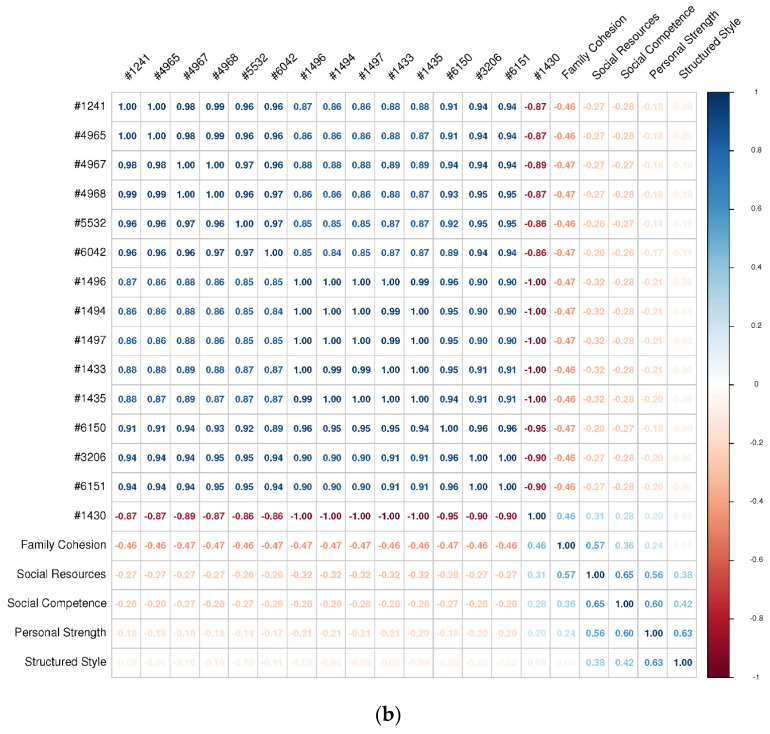
Figure 5.
(a). The correlations between each RSA score and each ComParE2013 paralinguistic feature (only negative memories). Because there were many statistically significant correlations (p < 0.05), only paralinguistic features with at least one |r| > 0.46 were included in this plot. #3910 = F0final_sma_de_quartile3; #3912 = F0final_sma_de_iqr2−3; #5367 = mfcc_sma[9]_linregc2; #5120 = pcm_fftMag_spectralSlope_sma_centroid; #5166 = pcm_fftMag_spectralHarmonicity_sma_centroid; #4154 = audspec_lengthL1norm_sma_centroid; #4200 = pcm_RMSenergy_sma_centroid; #4982 = pcm_fftMag_spectralFlux_sma_centroid; #5966 = pcm_fftMag_fband1000−4000_sma_de_stddevRisingSlope; #6042 = pcm_fftMag_spectralFlux_sma_de_meanFallingSlope. (b). The correlations between each RSA score and each ComParE2013 paralinguistic feature (positive & negative memories). Because there were many statistically significant correlations (p < 0.05), only paralinguistic features with at least one |r| > 0.46 were included in this plot. #1241 = pcm_fftMag_spectralFlux_sma_range; #4965 = pcm_fftMag_spectralFlux_sma_peakRangeAbs; #4967 = pcm_fftMag_spectralFlux_sma_peakMeanAbs; #4968 = pcm_fftMag_spectralFlux_sma_peakMeanMeanDis; #5532 = pcm_RMSenergy_sma_de_meanFallingSlope; #6042 = pcm_fftMag_spectralFlux_sma_de_meanFallingSlope; #1496 = pcm_fftMag_spectralHarmonicity_sma_iqr2−3; #1494 = pcm_fftMag_spectralHarmonicity_sma_quartile3; #1497 = pcm_fftMag_spectralHarmonicity_sma_iqr1−3; #1433 = pcm_fftMag_spectralSlope_sma_iqr1−2; #1435 = pcm_fftMag_spectralSlope_sma_iqr1−3; #6150 = pcm_fftMag_spectralHarmonicity_sma_de_posamean; #3206 = pcm_fftMag_spectralHarmonicity_sma_de_stddev; #6151 = pcm_fftMag_spectralHarmonicity_sma_de_rqmean; #1430 = pcm_fftMag_spectralSlope_sma_quartile1.


