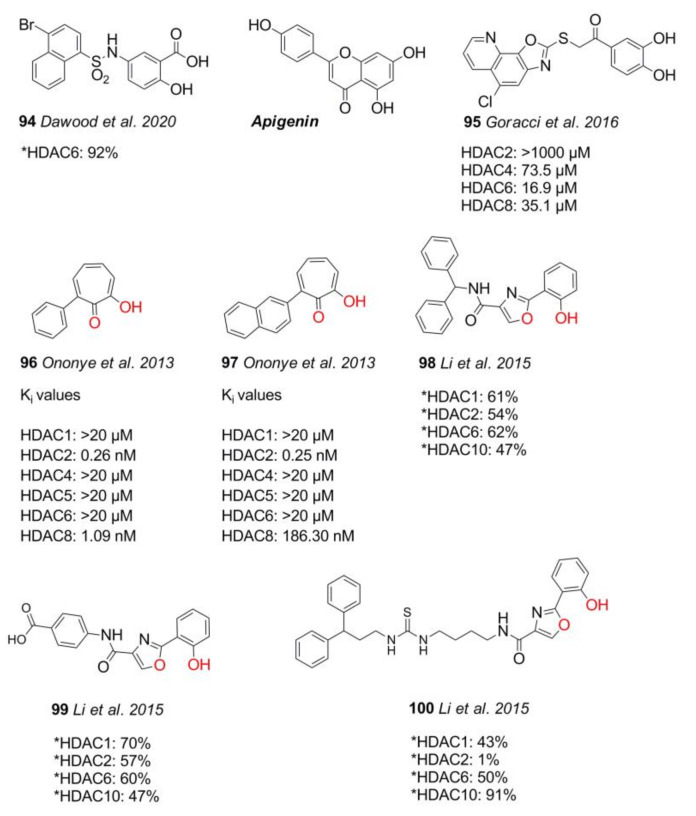
Figure 21.
Shown are miscellaneous compounds with diverse ZBGs. Ononye et al. [170] and Li et al. [172], through docking, suggested the chelating atoms highlighted in red. * Inhibitory activity is given as the percentage inhibition of HDACs in the presence of 94 (10 µM) and 98–100 (20 µM). Ki values are displayed for compounds 96 and 97.

