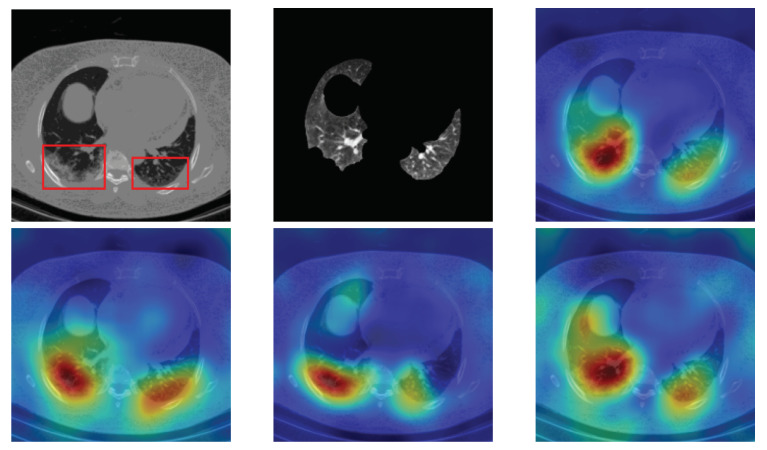
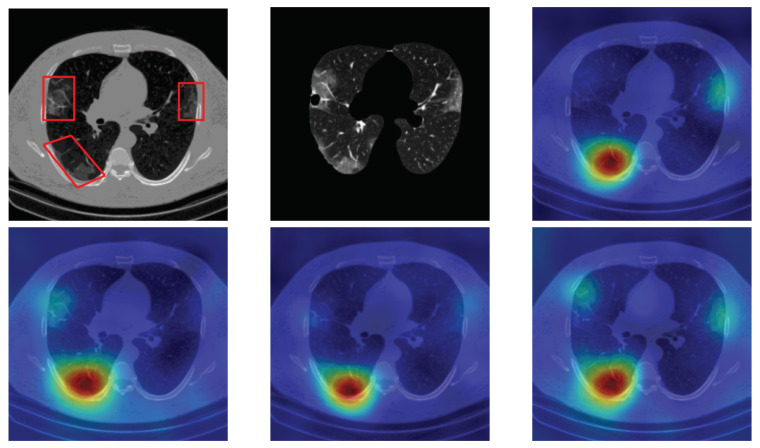
Figure 13.
RISE heat map examples of COVID-19 slice images using the trained multi-tasks CNN architectures (ResneXt-50, Densenet-161, Inception-v3, and Wide-Resnet-50). The first example is shown in the first two rows, where the images represent the input slice image and segmented lung lobes results, followed by the heat maps of ResneXt-50, Densenet-161, Inception-v3, and Wide-Resnet-50, respectively. The second example is in rows 3 and 4.


