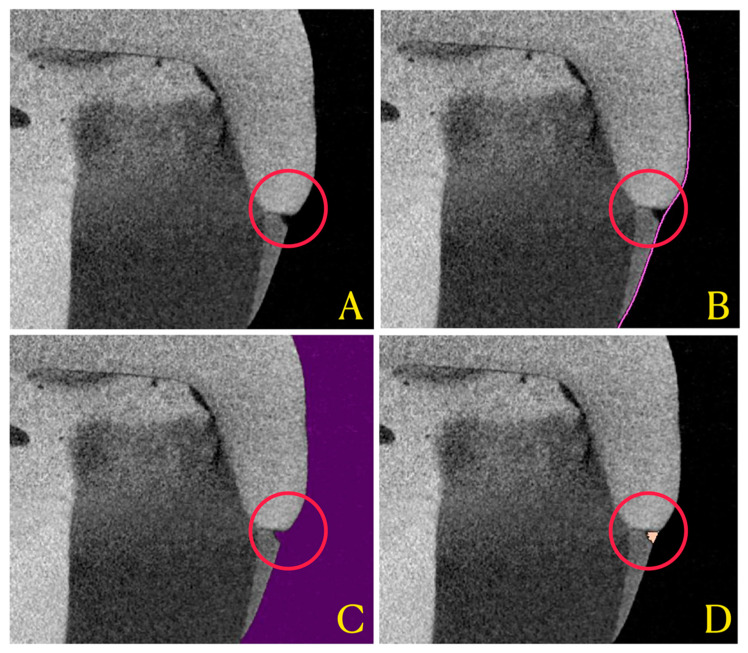
Figure 2.
Applied workflow for 3D interfacial gap analysis. (A) represents the obtained micro-CT reconstructed image, imported in the segmentation software (Mimics 23, Materialise, Belgium). (B) shows the region of interest (ROI) defined by the software for gap analysis (pink line). (C) shows the void thresholding performed (violet mask) that defines “void” concept through all samples. (D) shows the intersection between the ROI and the void mask, ultimately representing interfacial gap (orange mask).

