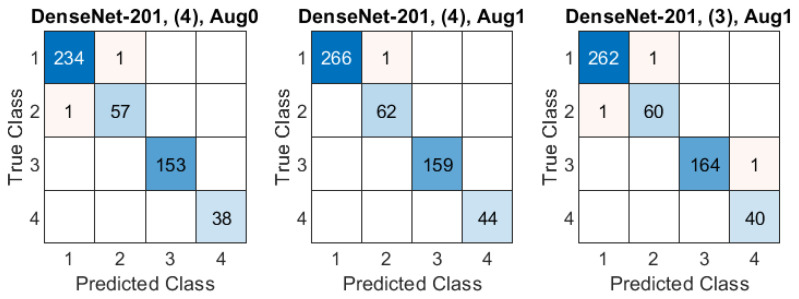
Figure 13.
Confusion matrices in three best-case classification models from Figure 11 and Figure 12 over a limited dataset with respect to the value. Class IDs: 1–AD, 2–psoriasis, 3–skin tumor, 4–control group. Models are specified above each matrix in a format: model name, ROI extraction mode, data augmentation mode.

