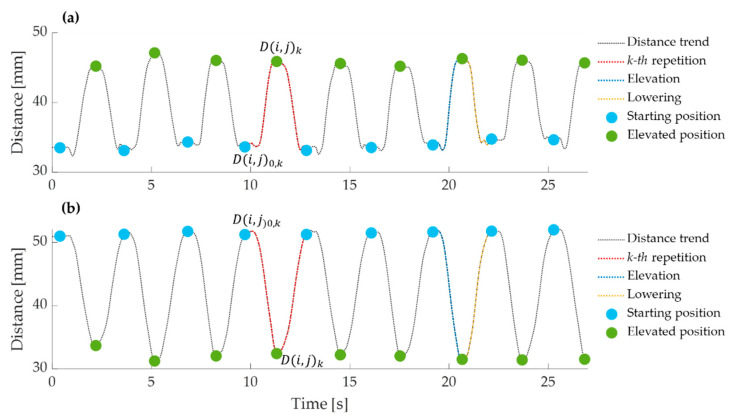
Figure 5.
Two examples of distance trend (in black) between pairs of markers collected on a volunteer during a trial. The ten repetitions are visible. The distance during a repetition is highlighted in red, during an elevation phase in blue, and during a lowering phase in yellow. The events corresponding to the starting and elevated positions are highlighted by light blue and green circles, respectively. (a) Example of distance increasing during the elevation phase (in blue) and decreasing during lowering (in yellow), which means a skin extension, and (b) example of distance decreasing during the elevation phase (in blue) and increasing during the lowering (in yellow) which means a skin compression.

