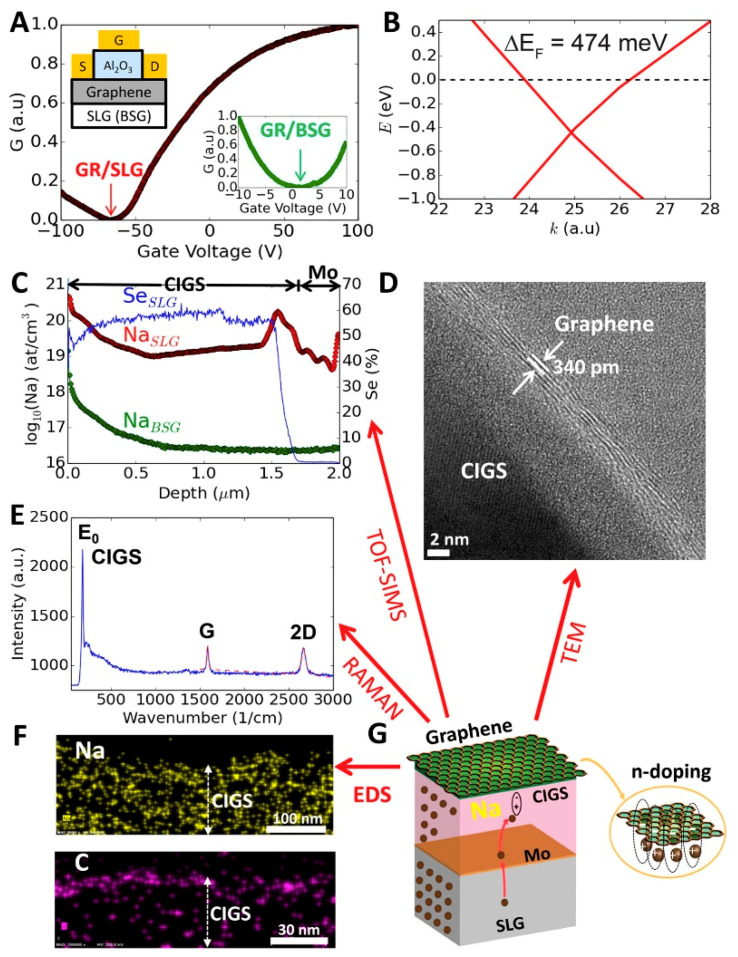
Figure 2.
(A) Normalised conductance (G) vs. gate-voltage (VG) of G (GR)/soda-lime glass (SLG) and GR/borosilicate glass (BSG) (inset) measured in FET configuration; (B) DFT curve showing G–Na n-doping interactions; (C) Na and Se depth-profiles in CIGS/Mo/SLG and CIGS/Mo/BSG from TOF-SIMS; (D) cross-sectional HR-TEM image of GR/CIGS/Mo/SLG; (E) Raman spectra of GR/CIGS/Mo/SLG; (F) EDS mapping of GR/CIGS/Mo/SLG showing Na (yellow, top) and C (purple, bottom); and (G) Schematic of G n-doping mechanism on CIGS. Reproduced from Dissanayake et al. (2016) [43].

