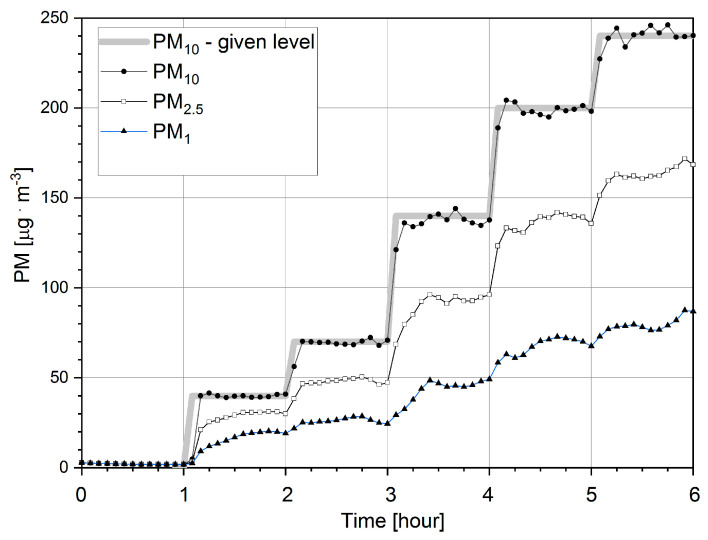
Figure 5.
The concentrations of particulate matter PM1, PM2.5 and PM10 recorded as a function of time by reference station EDM 107 during the background level measurement (the first hour) and the programed five levels at 40, 70, 140, 200 and 240 µg · m−3. The data presented in this figure are the mean values of 5 min long measurements.

