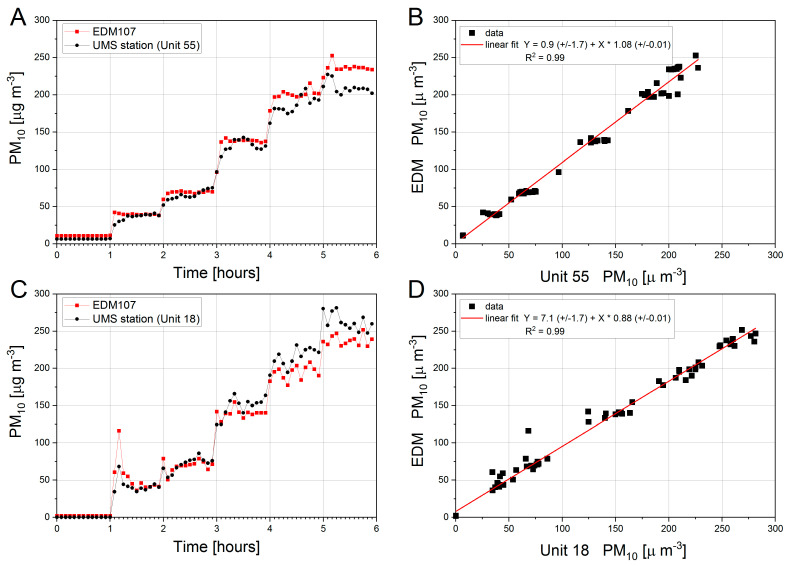
Figure 6.
Panels (A–D). Results of the PM10 calibration of two UMS stations (Unit 55, Unit 18) in concentration range from 40 to 240 µg·m−3. Panels A and C present PM10 values recorded as a function of time by EDM 107 are marked in red and those recorded by UMS stations—in black. Panels B and D present the relation of PM10 concentrations obtained from UMS (Unit 55 and Unit 18, respectively) and reference station EDM107. The linear fit was drawn as red line. The data presented in this figures are the mean values of 5 min long measurements.

