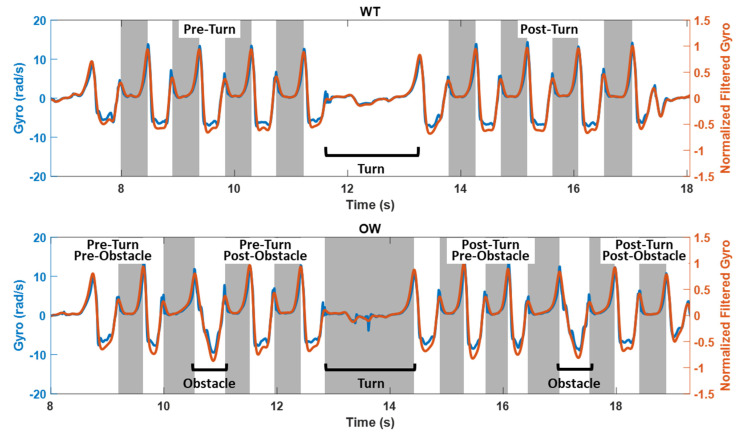
Figure 2.
Example HS and TO detection from normalized filtered gyro from the right foot for the WT task (top) and the OW task (bottom). Raw mediolateral gyro data and normalized, filtered gyro data are in blue and orange, respectively. Gray shading marks HS to TO. Phases of the tasks, turning, and obstacle crossings are labeled. Note that detection of HS and TO were dependent on the expected peaks in the filtered and normalized mediolateral gyro signal.

