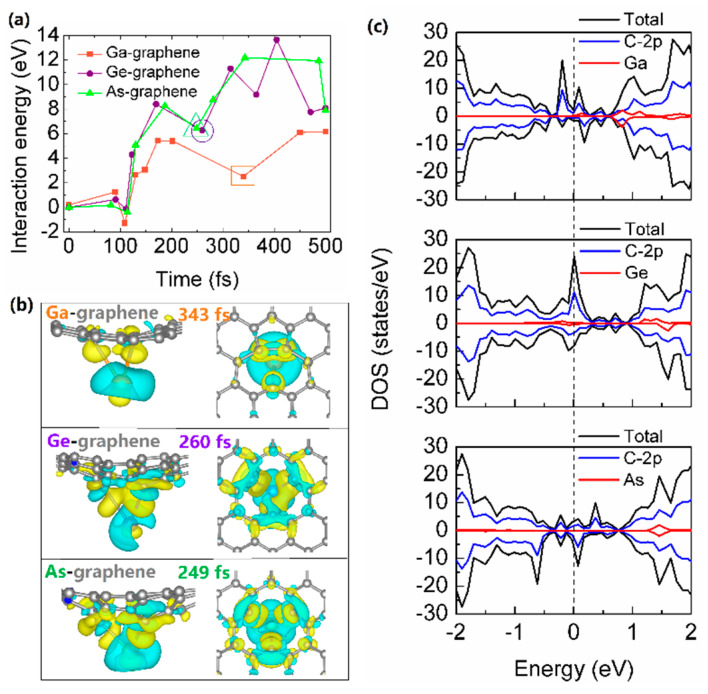
Figure 5.
(a) The interaction energies between incident Ga/Ge/As atom and graphene. Note that the irradiation-induced distorted graphene lattice is produced after about 100 fs, as depicted in Figure 4b. The charge density difference (b) and density of states (c) for the configuration that incident atom past through the plane of graphene with a maximum distance. The charge density of isolated Ga/Ge/As plus that of isolated distorted graphene is subtracted to the charge density of the full Ga/Ge/As-graphene system. The isosurfaces of charge density difference are taken to be at 0.01 electrons/Å3 (yellow represents charge accumulation) and 0.01 electrons/Å3 (blue represents charge depletion), respectively.

