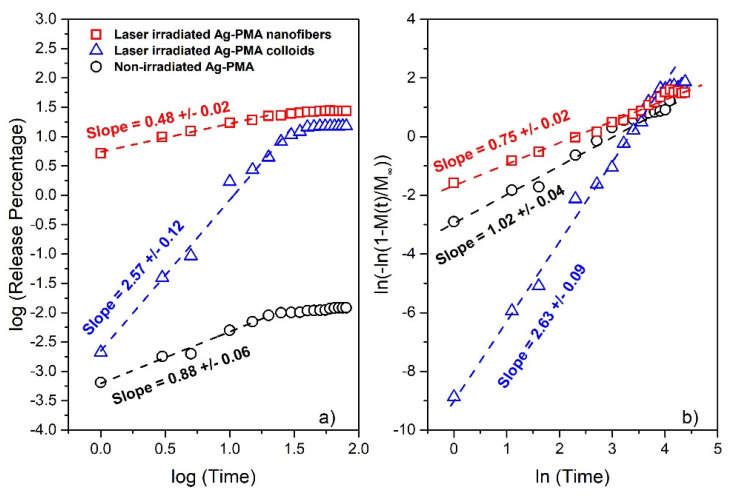
Figure 6.
Log-log plot of the drug release percentage vs. time in hours for SFT embedded in PMA-Ag matrix at different conditions (a). Linear correlations, corresponding to power law behavior, can be observed only for the initial release. Weibull plot of the same data to check if the Weibull function can be used to reproduce the whole release process for all the studied conditions (b). Data for the non-irradiated system refer to both colloids and nanofibers. In Figure S2 of Supplementary Materials we include the comparison with the irradiated PMA samples that show no significant release performances.

