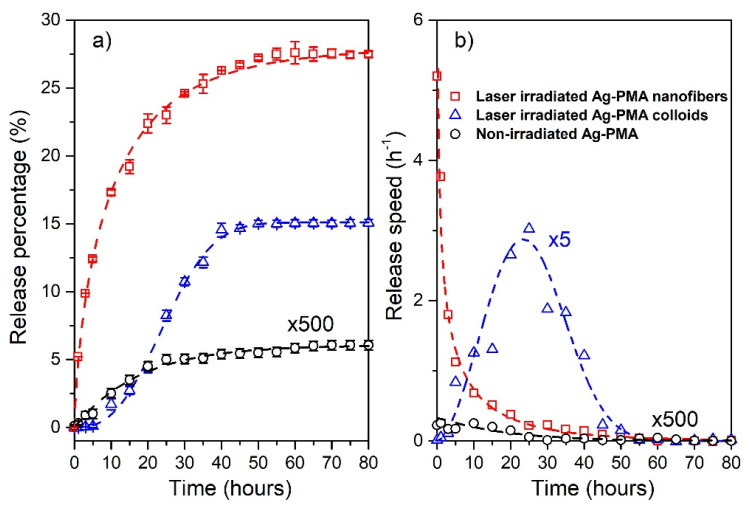
Figure 7.
The release percentage vs. time and the corresponding best-fit performed with the use of the Weibull CDF (Equation (1)) (dashed lines) are reported in panel (a). The Weibull PDFs corresponding to the release data and fitted curves are reported in panel (b). Data for the non-irradiated system, referred to both colloids and nanofibers, are multiplied by a factor 500. The release speed data for the irradiated colloids are multiplied by a factor 5. In Figure S3 of Supplementary Materials, we include the comparison with the irradiated PMA samples that show no significant release performances.

