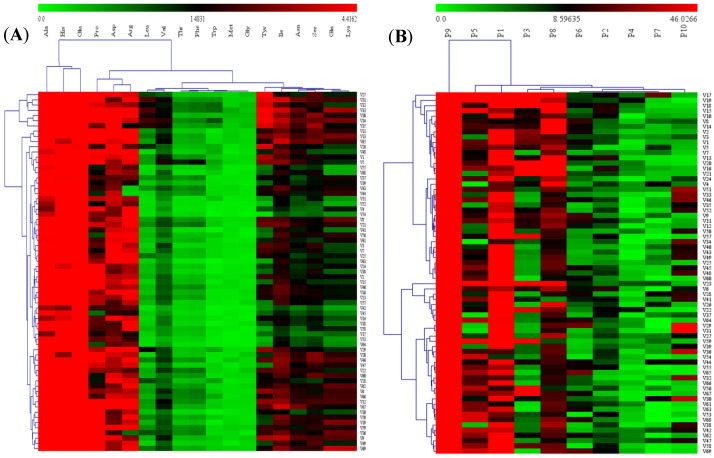
Figure 2.
Hierarchical clustering and heat map visualization showing the content of free amino acids (A) and polyphenols (B) identified in cabbage samples. Green indicates low content. Dark indicates intermediate content, and red indicates high content. P1–P10 are defined in Figure 1.

