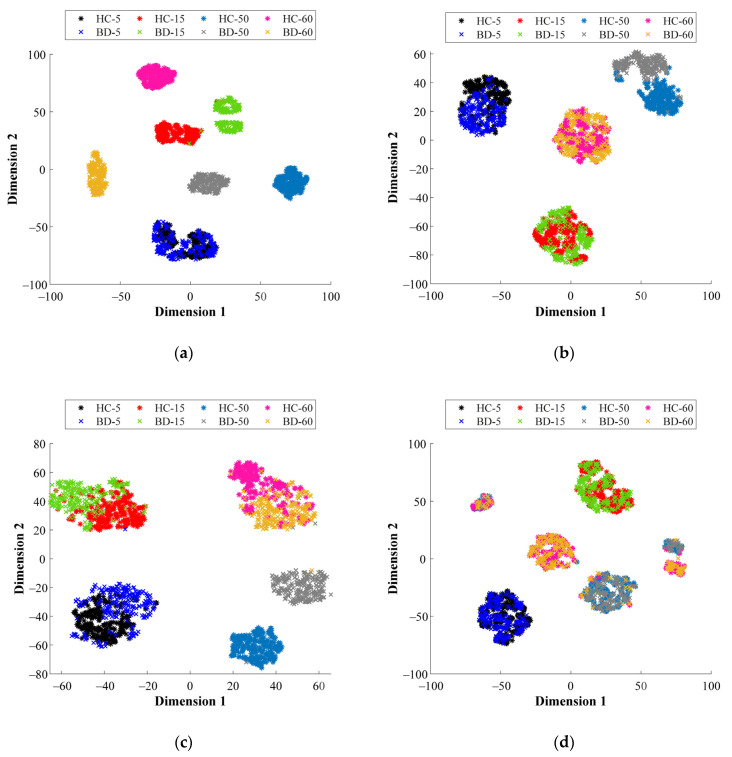
Figure 9.
Two-dimensional visual representations of the data distribution achieved by the T-SNE technique over the resulting feature spaces mapped by their corresponding SAE of the metallic bearing when analyzing: (a) vibrations signals in FD, (b) stator current signature in FD, (c) vibrations signals in TFD and (d) stator current signature in TFD.

