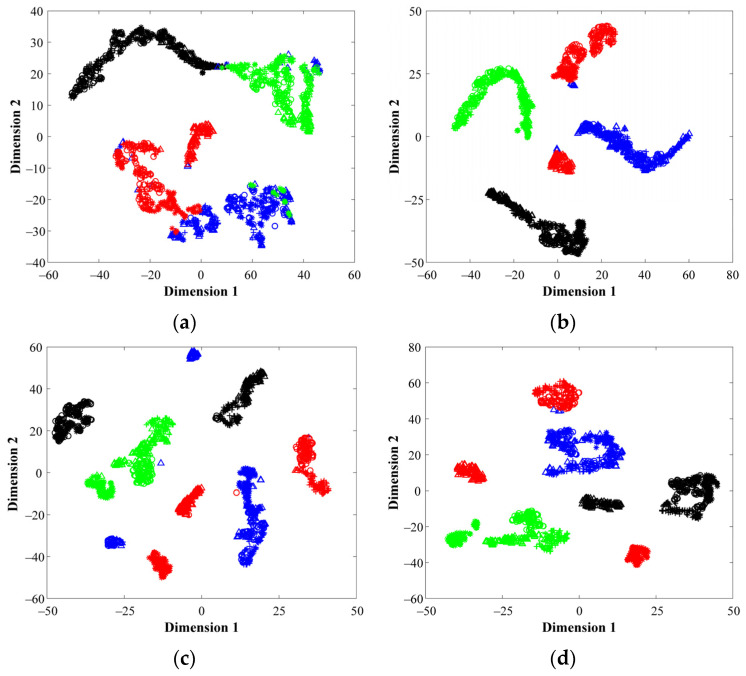
Figure 13.
Feature visualization via t-SNE for: (a) time domain, (b) frequency domain (c) time–frequency domain and (d) fusion scheme. The colors used to represent the clusters shown in the resulting projections belong to the NC (●), BF (●), IF (●) and OF (●) conditions, where the different load conditions for each bearing condition are represented by the markers △, +, ○ and *, respectively.

