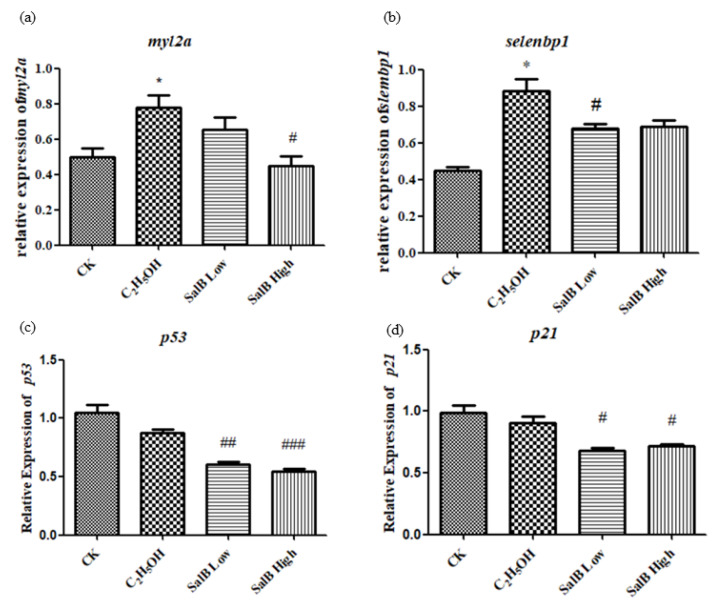
Figure 10.
The expression of myl2a (a), selenbp1 (b), p53 (c) and p21 (d) after Sal B added in the group of ethanol acute toxicity treatment. The statistical results shown represent the means (n = 3); vs. the control group (n = 3) * p < 0.05, ** p < 0.01, *** p < 0.001 vs. the ethanol-treated group (n = 3) # p < 0.05, ## p < 0.01, ### p < 0.001.

