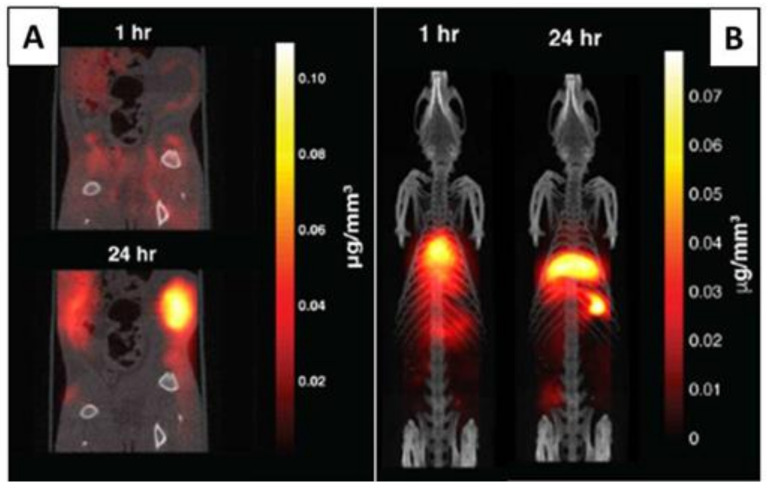
Figure 16.
(A) Tracer dynamics in group A rats. Slices through the MPI volume over time are co-registered to corresponding CT slices. The MPI images show the SPIONs’ dynamics, from initial rim enhancement and accumulation until the maximum signal. (B) Tracer dynamics in group B rats. Maximum intensity projection of 3D MPI volumes co-registered with CT skeletal reference. Adapted with permission from [117], Copyright 2017 American Chemical Society.

