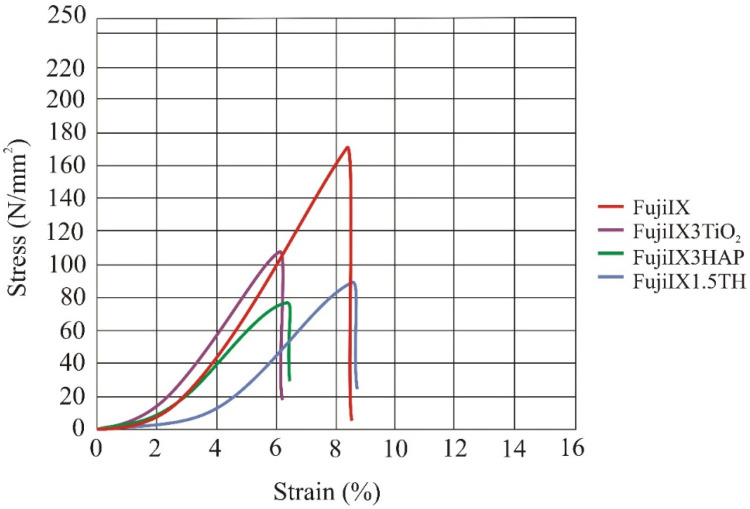
Figure 4.
Compression stress–strain diagram. The mean values for the four groups of materials (N = 6) are shown in the diagram. The control group in which Fuji IX was not modified exhibited the highest compressive stress and compressive strength. Legend: FujiIX is a control group, FujiIX3TiO2 is material with 3% of TiO2, FujiIX3HAP is material with 3% HAp and FujiIX1.5TH material with 1.5% of TiO2 and 1.5% of HAp.

