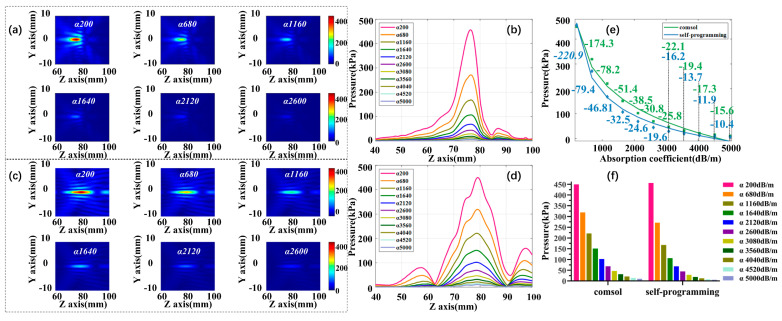
Figure 10.
The effect of absorption coefficient varied on focus acoustic pressure. (a) Self-programming focus acoustic pressure field; (b) self-programming acoustic axis acoustic pressure curve; (c) COMSOL focus acoustic pressure field; (d) COMSOL acoustic axis acoustic pressure curve; (e) focus acoustic pressure variation fitting curves for both simulations; (f) histogram of focus acoustic pressure variation for both simulations.

